Connectivity models were produced using BCFishPass, an open-source freshwater connectivity modelling framework, which combines provincial spatial layers with WCRP-specific data tables and includes two sub-models:
Accessibility Model
Naturally accessible waterbodies are those that would likely be accessible to focal species if no human-made barriers existed on the landscape. This is treated as a proxy baseline for the historic distribution. Naturally accessible waterbodies were identified based on natural barriers (i.e., waterfalls, areas with subsurface flows, or steep stream gradients) that would naturally limit upstream movement. Modelled natural barriers were excluded if focal species observations existed upstream of them. For Pacific salmon and steelhead, waterbodies are considered accessible if they are accessible to at least one focal species.
Habitat Model
A subset of the naturally accessible waterbody layer that is defined as key habitat (e.g., habitat likely to support spawning or rearing) (henceforth habitat), rather than simply being used as a movement corridor. An intrinsic potential modelling approach was used to identify areas that have the potential to support spawning or rearing for Pacific salmon and steelhead based on stream characteristics such as gradient, channel width and discharge. For Pacific salmon and steelhead, habitat was identified by removing first-order streams from the accessible waterbody layer, recognizing that these streams typically have low habitat value for these species. All accessible areas were considered potential habitat. Habitat model outputs are overruled by field data and local knowledge of habitat condition and use. Areas identified as habitat for at least one focal species were included as habitat overall.
Connectivity Modelling
The overall model used to estimate connectivity status and rank structures. A layer of known or modelled structures was overlaid on the habitat model output. Modelled stream crossings were created from stream network and road/railway Geographic Information System (GIS) data, by mapping where a road or railway crosses a stream. Dam data were obtained from the Canadian Aquatic Barriers Database (aquaticbarriers.ca). All mapped dams and modelled crossings (henceforth structures) downstream of habitat were considered, but some were classified as non-existent or passable prior to initiating field work and excluded from the model: stream crossings on 6th order and larger streams were assumed to be bridges and classified as passable, as were those identified as bridges in available infrastructure spatial layers. Remaining structures downstream of habitat were examined on ortho satellite imagery (Google, Bing) to exclude structures if they could be visibly verified to be a bridge, not exist, or were cross ditches that did not connect to a stream. Data from previous field assessments were incorporated, and structures identified as passable were excluded. Assessed barriers, dams lacking fishways, and unassessed structures were all treated as barriers in the connectivity model.
Local knowledge and data were incorporated into model development in two phases and typically overruled modelled outputs where the two differed. Existing reports on habitat, barriers, and fish distributions, when available, were incorporated into the initial model outputs. Maps of initial outputs were then shared with local knowledge holders, who identified model errors or omissions (e.g., unmapped structures, mapped structures that do not exist, known spawning or rearing habitat that was not identified by the model, habitat identified by the model that is known to be inaccessible or unsuitable). The status of closed-bottom structures identified as passable by local knowledge may not have been adjusted until confirmed by field assessments.
Models were run to produce initial connectivity outputs, and maps were created showing disconnected habitat and associated structures. For diadromous species, connectivity status was estimated by calculating the proportion of habitat that is connected to the ocean (i.e., not fragmented by human-made barriers). Habitat with no structures or only passable structures downstream was considered connected.
Structure Ranking
Structures were ranked by the amount of habitat upstream, with the highest ranked structure given a rank of 1. Unassessed structures were considered barriers for ranking purposes. Ranks generally represent the relative amount of habitat upstream. Actual ranking processes are more complex to account for situations where multiple barriers may need to be addressed to reconnect habitat. Barriers with the most habitat upstream may not provide any benefits to focal species until downstream barriers are addressed.
To manage this, both the overall habitat upstream, and immediate gains (i.e., the amount of habitat to the next structure) are incorporated into the ranking process. This ensures that the first structure encountered by fish is given a high rank, even if, for example, it blocks less than 1 km of habitat. Conversely, a structure blocking 20 km of habitat may be given a lower rank if many downstream structures must be addressed before those gains can be realized.
Structures are also combined into sets by considering which configuration of groups of up to five structures provides the greatest per-barrier habitat gain. Sets are often identified sequentially by first identifying optimal downstream set configurations, then considering additional upstream sets.
Weighted Ranks Based on Stream Habitat Features and Pressures
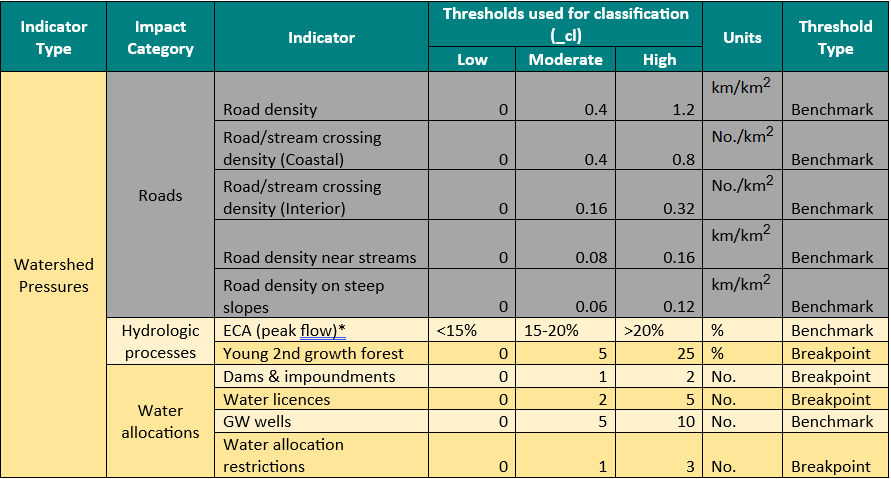
The Skeena Sustainability Assessment Forum (SSAF) evaluated the state of fish and fish habitat in the Skeena River Basin, including the Bulkley River watershed, using a set of 21 indicators to reflect anthropogenic pressures, sensitivity, and importance of individual subwatersheds as salmon habitat within the basin (Table 7; SSAF 2021; Eclipse Geomatics 2021). These include 5 indicators related to pressure from roads, 4 indicators related to waters allocations and uses, 2 land cover disturbance indicators, 2 pollution indicators, 4 indicators of watershed sensitivity, and 2 indicators of watershed importance to salmon habitat. Details on how SSAF indicators were derived and evaluated can be found in the Skeena ESI Fish & Fish Habitat Decision Maker Synthesis Report Working Draft for Discussion Version 1.0 (Eclipse Geomatics, 2021).
The Office of the Wet’suwet’en, which represents the Wet’suwet’en Nation and hereditary chiefs, has expressed interest in exploring ways to apply the SSAF indicator ratings to management decisions within their traditional unceded territories (the Yintah). To assist with this exercise, the Canadian Wildlife Federation used a subset of the SSAF indicators to “weight” the order that barriers to fish passage within the Bulkley River watershed were ranked. All indicators were used in the weighting, with the exception of those related to roads and those reflecting the importance of watersheds as salmon habitats, since both of those indicators are already reflected in the WCRP models (Table 7). Weightings of the remaining indicators were used to create two scenarios: one which upweights habitats that are less disturbed or least sensitive to disturbance in the barrier rankings, and one that upweights habitats that are more disturbed or most sensitive to disturbance in the barrier rankings. Details of how weighted ranks were derived can be found in Appendix B.
Whether to focus on subwatersheds that are least disturbed and can therefore allow Pacific salmon and steelhead to benefit from improved connectivity to relatively intact habitats immediately once a barrier is restored, or the decision to focus on the more disturbed habitats to relieve some pressure by opening up access to more habitats within a subwatershed is a social and cultural decision that requires input from the Wet’suwet’en clans and Yikhs and is therefore not explored further in this document.